• Data lifecycle management for seamless source-to-destination data movement, next-gen analytics and AI integration.

          Advanced Data ETL, Reporting and Gen AI

          No-code data engineering
          Automated data transformation
          Enterprise-grade LLM
          MODULES

          An automated data orchestration and pipeline management platform.

          An AI-powered, enterprise-ready Gen AI platform for internal teams.

          Healthcare Data Management

          Parsing engine and interactive mapper.

          Precision parsing, mapping, transformation & health data analytics.

        • Data lifecycle management for seamless source-to-destination data movement, next-gen analytics and AI integration.

          Advanced Data ETL, Reporting and Gen AI

          No-code data engineering
          Automated data transformation
          Enterprise-grade LLM

          Custom, integrated predictive layer.

          Automated data movement for faster time-to-insights.

          Consolidated data for improved accessibility.

          Structured data for reporting, analytics and model training.

        • Data lifecycle management for seamless source-to-destination data movement, next-gen analytics and AI integration.

          Advanced Data ETL, Reporting and Gen AI

          No-code data engineering
          Automated data transformation
          Enterprise-grade LLM

          Visual insights to help you optimize your data for analytics.

          Insider knowledge into proven methodologies and best data practices.

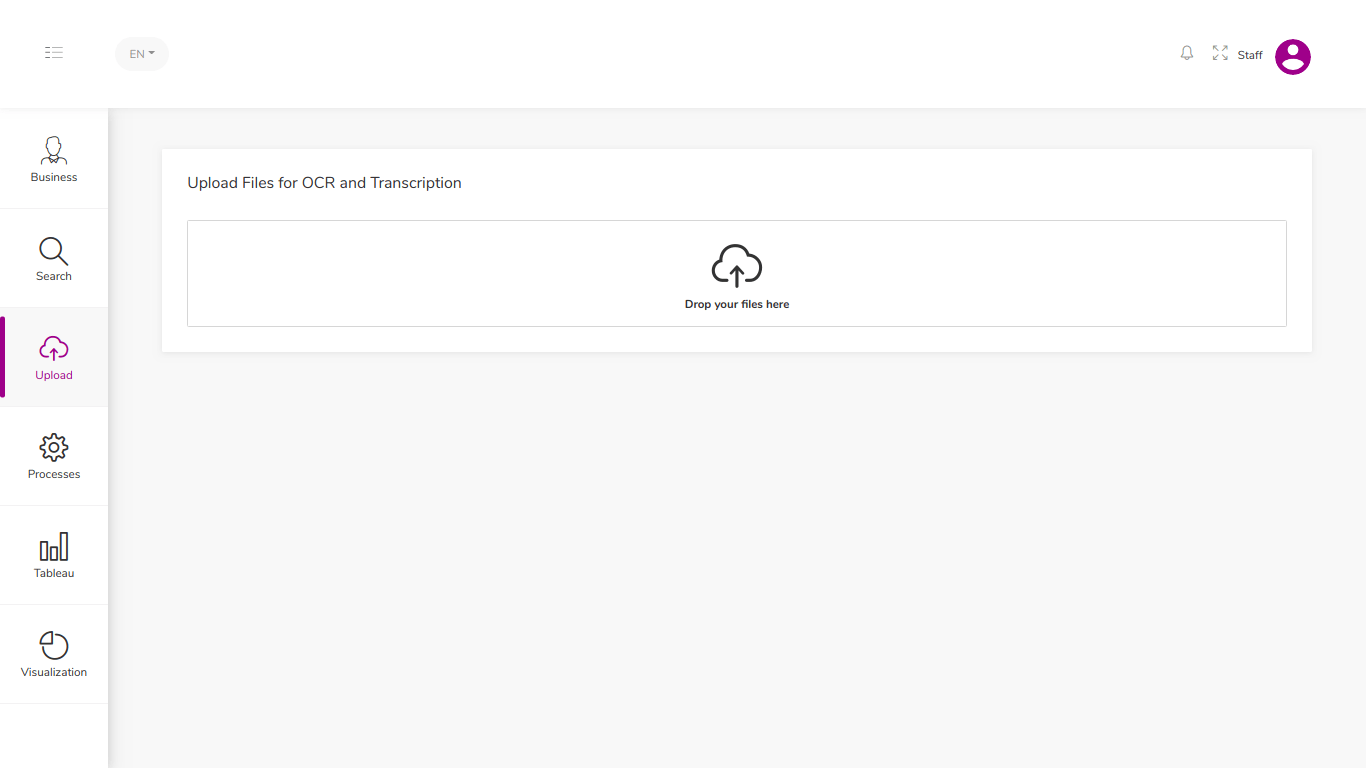
          Explore how businesses leveraged our data solutions to their advantage.

          Keep up with the latest trends to scale faster and outwit competition.

        • Data lifecycle management for seamless source-to-destination data movement, next-gen analytics and AI integration.

          Advanced Data ETL, Reporting and Gen AI

          No-code data engineering
          Automated data transformation
          Enterprise-grade LLM

          We are a bold team supporting bold leaders like you ready to adopt and migrate to new technologies.

          Discover the essence of our tech beliefs and explore the possibilities they offer your business.

          Unlock your business potential by leveraging Gen AI and capitalizing on rich datasets.

          Lead your business to new heights and scale effortlessly with expert guidance along the entire customer journey.

  • Join the team
Technology

TechVariable creates a solution that speeds up data collection, improves accuracy, and generates real-time reports of trends

04

Engineers

03

Months

30%

Increase in Tech Efficiency

Overview

We developed a one-stop module for a Malaysian client that provides an interface between multiple, disparate data sources for generating business KPIs.

The client is an HR tech giant that provides its customers with Key Performance Indicators (KPIs).

The customers can now pull data from multiple, disjointed data sources to generate meaningful, holistic insights and KPIs. And the automation through schedulers and data push to BI systems increases the efficiency of the KPI generation.

Services

Product Engineering, Application Modernization, ETL as a Service

Technology

AWS, Node.js, Python, React.js, Mongo DB, Tableau, Kibana

Location

Malaysia

Challenges

A Malaysian news agency wanted to automate insight-mining from enormous amounts of data collected from various disparate sources, so they could speed up the generation of useful reports on key societal trends. Their reports were often used by the government to understand trends such as drug usage. Currently, data was being captured from social media, newspapers, and physical scanning of documents, before being manually stored in spreadsheets and analyzed for trends.

The current process was labor-intensive, time-consuming, and inefficient. It was also prone to errors and was not very scalable.

Technical challenges in the existing solution

Manual data entry: Data from different sources was manually entered into spreadsheets.

No standardization: Data came in different formats, sizes, and languages, and needed to be harmonized.

Limitations on the number of requests handled: Current AWS Lambda services had limitations on the number of requests processed at any given time.

Lack of customization: No access control through role management.

Reports lacked insights: No visualization of data to report high-level trends.

Solutions

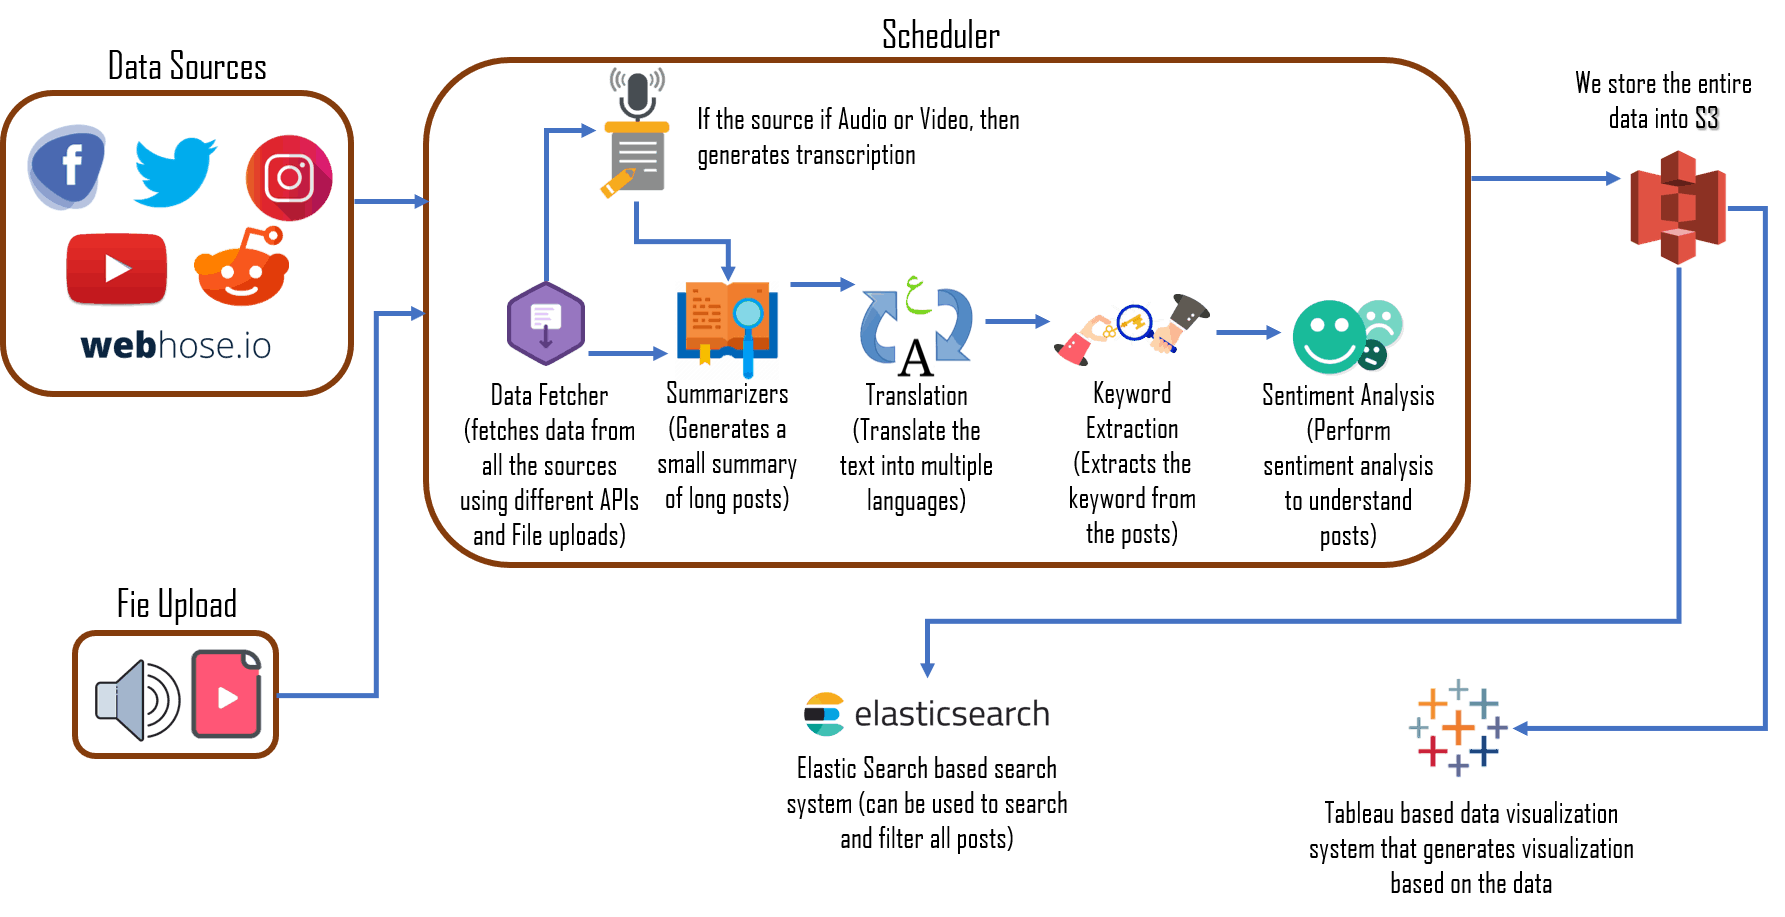
TechVariable built a platform that automated data collection and segregation, harmonized different file types into a cohesive set of data files, and enabled the generation of reports with data visualization in real time. With an easy-to-use, interactive, and customized user interface solution, we created three automated data pipelines:

We created three automated data pipelines:

Pipeline 1: A custom scraping engine collects data from all online sources, extracts data from hardcopy formats, PDFs, and jpegs using Optical Character Recognition (OCR), and summarizes lengthy articles according to identified keywords.
Pipeline 2: Video transcription using Google APIs to process video and audio files from YouTube or otherwise.
Pipeline 3: A custom-built mechanism for online sources that segregates hashtags, keywords, stories, etc. for further processing.

Modules implemented

Social Media Aggregation

Data from multiple social media platforms such as Facebook, Twitter, Instagram, YouTube, and Reddit are aggregated for relevant hashtags and keyword inputs.

Transcription & Translation

With this feature, the client can translate or generate transcripts of videos from YouTube or offline sources in different languages. Lengthy articles are summarized. A data warehouse was created and data was translated into four languages, as per the client’s request. A combination of third-party APIs and a few custom-built APIs have been used for data synchronization and processing.

Advanced Search

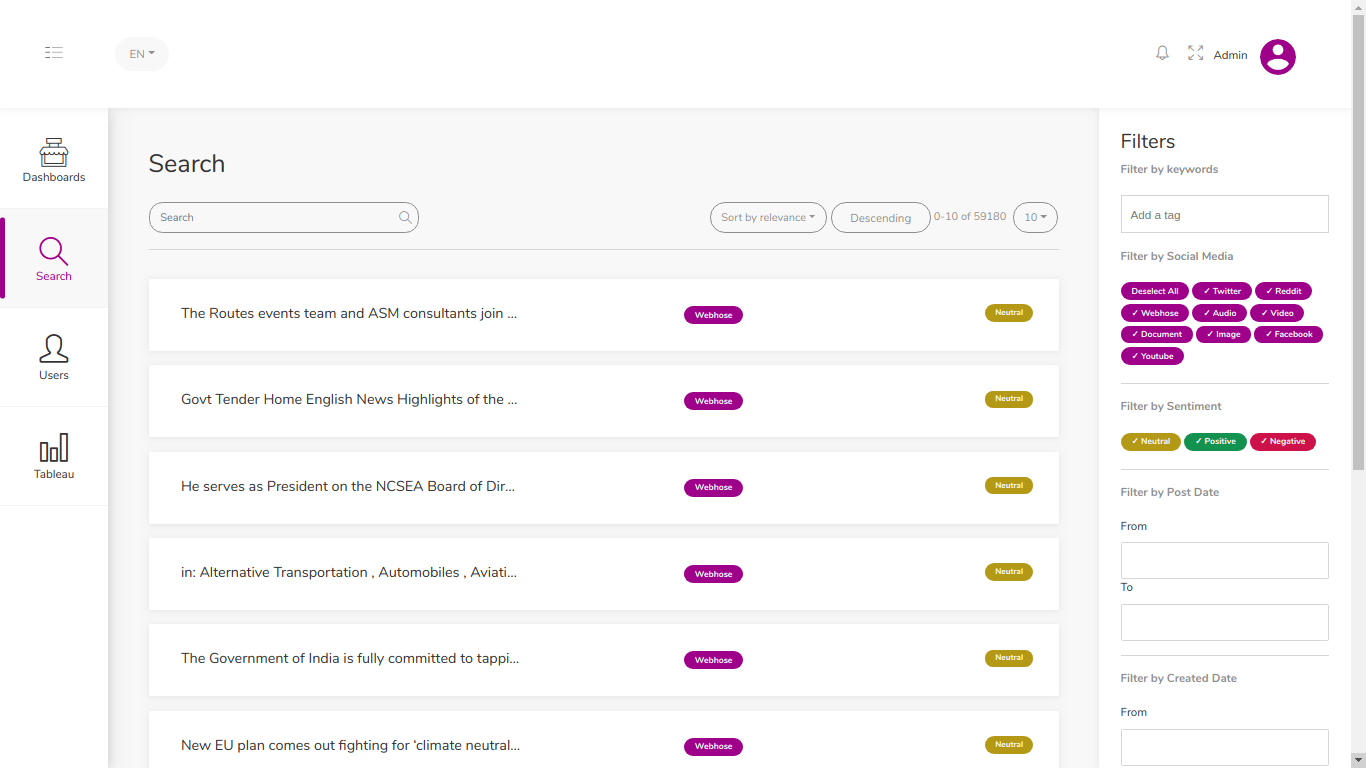
An elastic search-based system, including Fuzzy search, was built on top of the database. This functionality allows the user to add more keywords as they go, thus enhancing their search experience.

Multi-tenancy

The architecture was designed in such a way that the portal can run for multiple clients on multiple servers.

Reporting & Dashboard

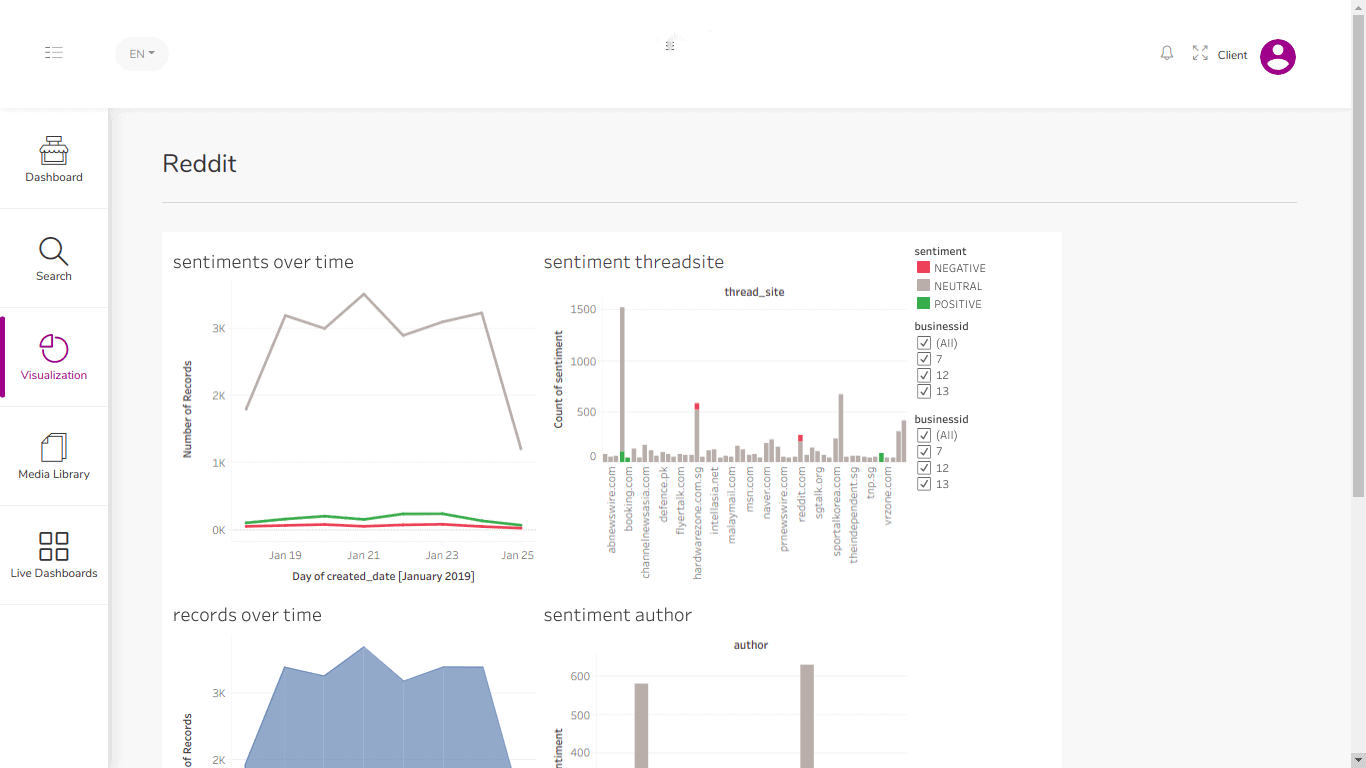
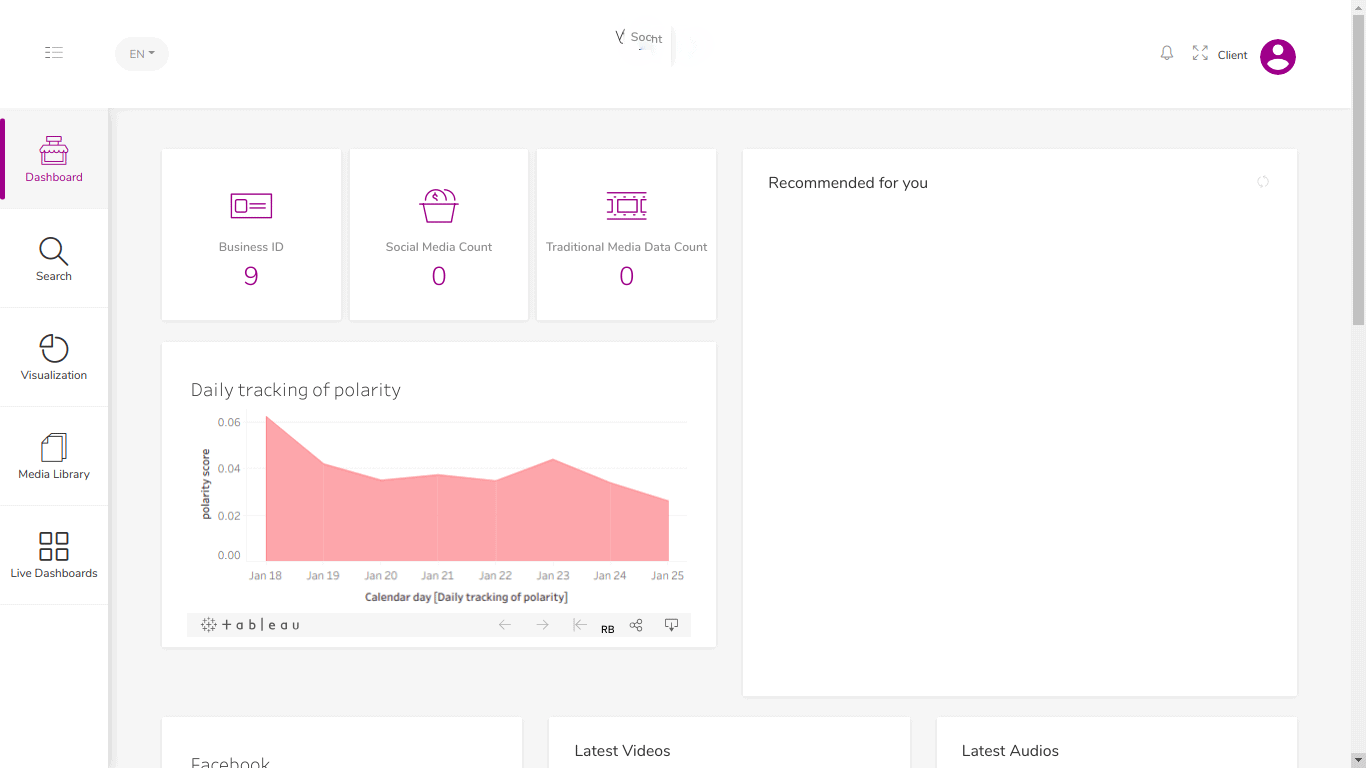
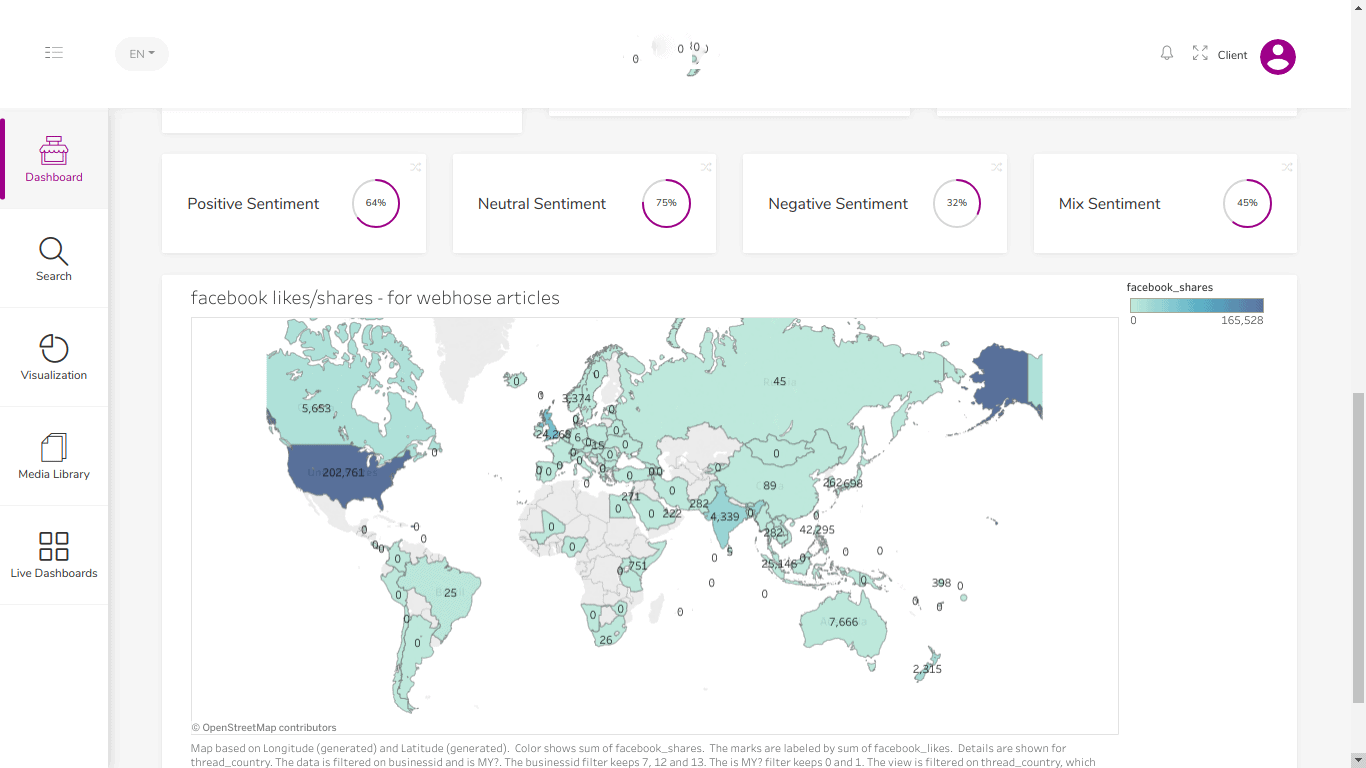
The solution includes an interactive dashboard built on Tableau that provides the client with a single-window view of important parameters in real time. Auto visualization and reporting were done for batches of old data and real-time data.

Sentiment Analysis

Auto-tagging has been enabled using Natural Language Processing (NLP) to segregate and analyze data. The data is then assigned positive, negative, or neutral scores.

High Level Design Architecture

Need to estimate for your next project?

We at TechVariable do acknowledge that one size will not fit all. Hence, we work in collaboration with you to identify, analyze & then develop a solution that fulfills your needs. Either we will define the functional scope of your project to estimate the timeline and budget or you can create your own agile team from among our resources.
estimate project

The Result

  1. The new platform leverages next-generation technologies to perform data collection, processing, and analysis in real-time.
  2. Improved efficiency, accuracy, and scalability as a result of automated data collection.
  3. Ability to conduct sentiment analysis on more than 100,000-150,000 posts a month on various parameters.
  4. Reduced the number of resources/man-hours required.
  5. Improved the ability to handle spikes in data generation and volumes of requests.
  6. Enabled customization with user access control, advanced filters, and search capabilities.
  7. Enabled auto-visualization and reporting in real time.
Previous slide
Next slide

See how our solutions are making a difference in healthcare